Visualise data to draw conclusions using a spreadsheet software
1.2.24 Visualize data to draw conclusion based on a data set using a spreadsheet software

MS ELECTRICAL ENGINEERING
Topics:
Visualising Data
Chart
Summary
Microcredential

Similar microcredentials
About this course
Share this course
Watching in another language? Turn on subtitles.
- Play the video so the YouTube player controls appear at the bottom.
- Click the CC button in the player to turn captions on or off.
- Open the Settings (gear) icon and choose Subtitles/CC, then pick your language.
What you'll learn
This video is about visualising data to draw conclusions using a spreadsheet software Visualizing data in a spreadsheet software like Microsoft Excel or Google Sheets is a powerful way to draw conclusions, identify patterns, and communicate insights.
Learning outcome
1.2.24 Visualize data to draw conclusion based on a data set using a spreadsheet software
Similar courses
-
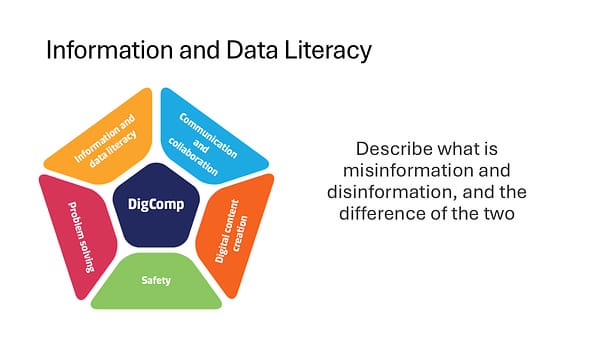
In today's digital age, information spreads fas...
misinformation disinformation
Rebecca Robinson
4 -
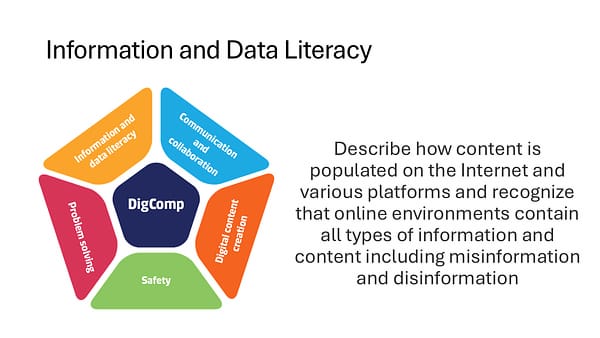
The internet is a great source of information, ...
online content misinformation disinformation
Rebecca Robinson
4
More courses by NEOFYTOS XENOFONTOS
-

In this video, we will learn how to sort and fi...
MS OutlookFilteringSorting
NEOFYTOS XENOFONTOS
0 -

This video aims to help the viewer to understa...
InternetInternet Service ProviderModem
NEOFYTOS XENOFONTOS
2